PT.3
Task 1:
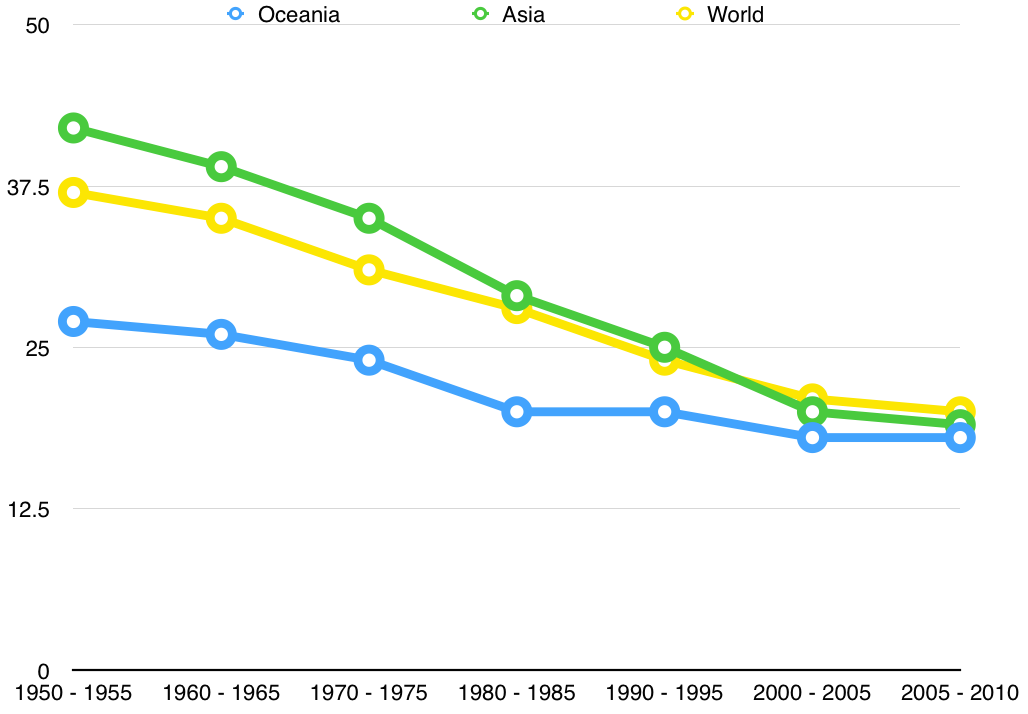
Draw a graph to show the CBR'S change in contrasting regions. In addition plot the change in world CBR'S over the same period.
Task 2:
Identify 3 trends from your graph and use data to describe them.
Asia has had the largest decrease in the crude birth rate. It has dropped from 42 births per 1000 population to 19, which is a huge drop of 23 (a change of 56%), where as there was only a drop of 9 in Oceania (a change of 30%). This may be because of the policy that was introduced in China in 1979, that forbade a family to have more than 1 child. In the years 1980 - 1985, there was a large drop of 6 children per 1000 population, which may have been the result of the policy in China.
The problem with making this comparison of regions is that Asia is such a big continent with many different regions, where as Oceania is a small continent with generally similar wealth and power between countries. Some regions of Asia are very poor, but others are very rich and powerful, so I think that if it were split up into further regions it would have a wider span.
All of the regions’ crude birthrate is declining. A larger factor for this may be because education is generally getting better, and more people are being educated so they can learn things such as family management, and about contraception.
Task 2:
The region with the closest birthrate to the world average is Latin America and the Caribbean.
The largest change from 1950 - 2010 is Latin America with a change of 24 (56% change).
The smallest change is Oceania with a change of 9 (30%).
The highest amount of births per 1000 population in 1950 was Africa with 48, and in 2010 was also Africa with 36, 17 higher than the next one down, Latin America and the Caribbean with 19. This is probably of factors such as the lack of education, so people don’t know about contraception and family management.
The lowest amount of births per 1000 population in 1950 was Europe with 21, and in 2010 was also Europe with 11. This is probably because education in Europe is at a higher standard than Africa.
Task 1:
Draw a graph to show the CBR'S change in contrasting regions. In addition plot the change in world CBR'S over the same period.
Task 2:
Identify 3 trends from your graph and use data to describe them.
Asia has had the largest decrease in the crude birth rate. It has dropped from 42 births per 1000 population to 19, which is a huge drop of 23 (a change of 56%), where as there was only a drop of 9 in Oceania (a change of 30%). This may be because of the policy that was introduced in China in 1979, that forbade a family to have more than 1 child. In the years 1980 - 1985, there was a large drop of 6 children per 1000 population, which may have been the result of the policy in China.
The problem with making this comparison of regions is that Asia is such a big continent with many different regions, where as Oceania is a small continent with generally similar wealth and power between countries. Some regions of Asia are very poor, but others are very rich and powerful, so I think that if it were split up into further regions it would have a wider span.
All of the regions’ crude birthrate is declining. A larger factor for this may be because education is generally getting better, and more people are being educated so they can learn things such as family management, and about contraception.
Task 2:
The region with the closest birthrate to the world average is Latin America and the Caribbean.
The largest change from 1950 - 2010 is Latin America with a change of 24 (56% change).
The smallest change is Oceania with a change of 9 (30%).
The highest amount of births per 1000 population in 1950 was Africa with 48, and in 2010 was also Africa with 36, 17 higher than the next one down, Latin America and the Caribbean with 19. This is probably of factors such as the lack of education, so people don’t know about contraception and family management.
The lowest amount of births per 1000 population in 1950 was Europe with 21, and in 2010 was also Europe with 11. This is probably because education in Europe is at a higher standard than Africa.
 RSS Feed
